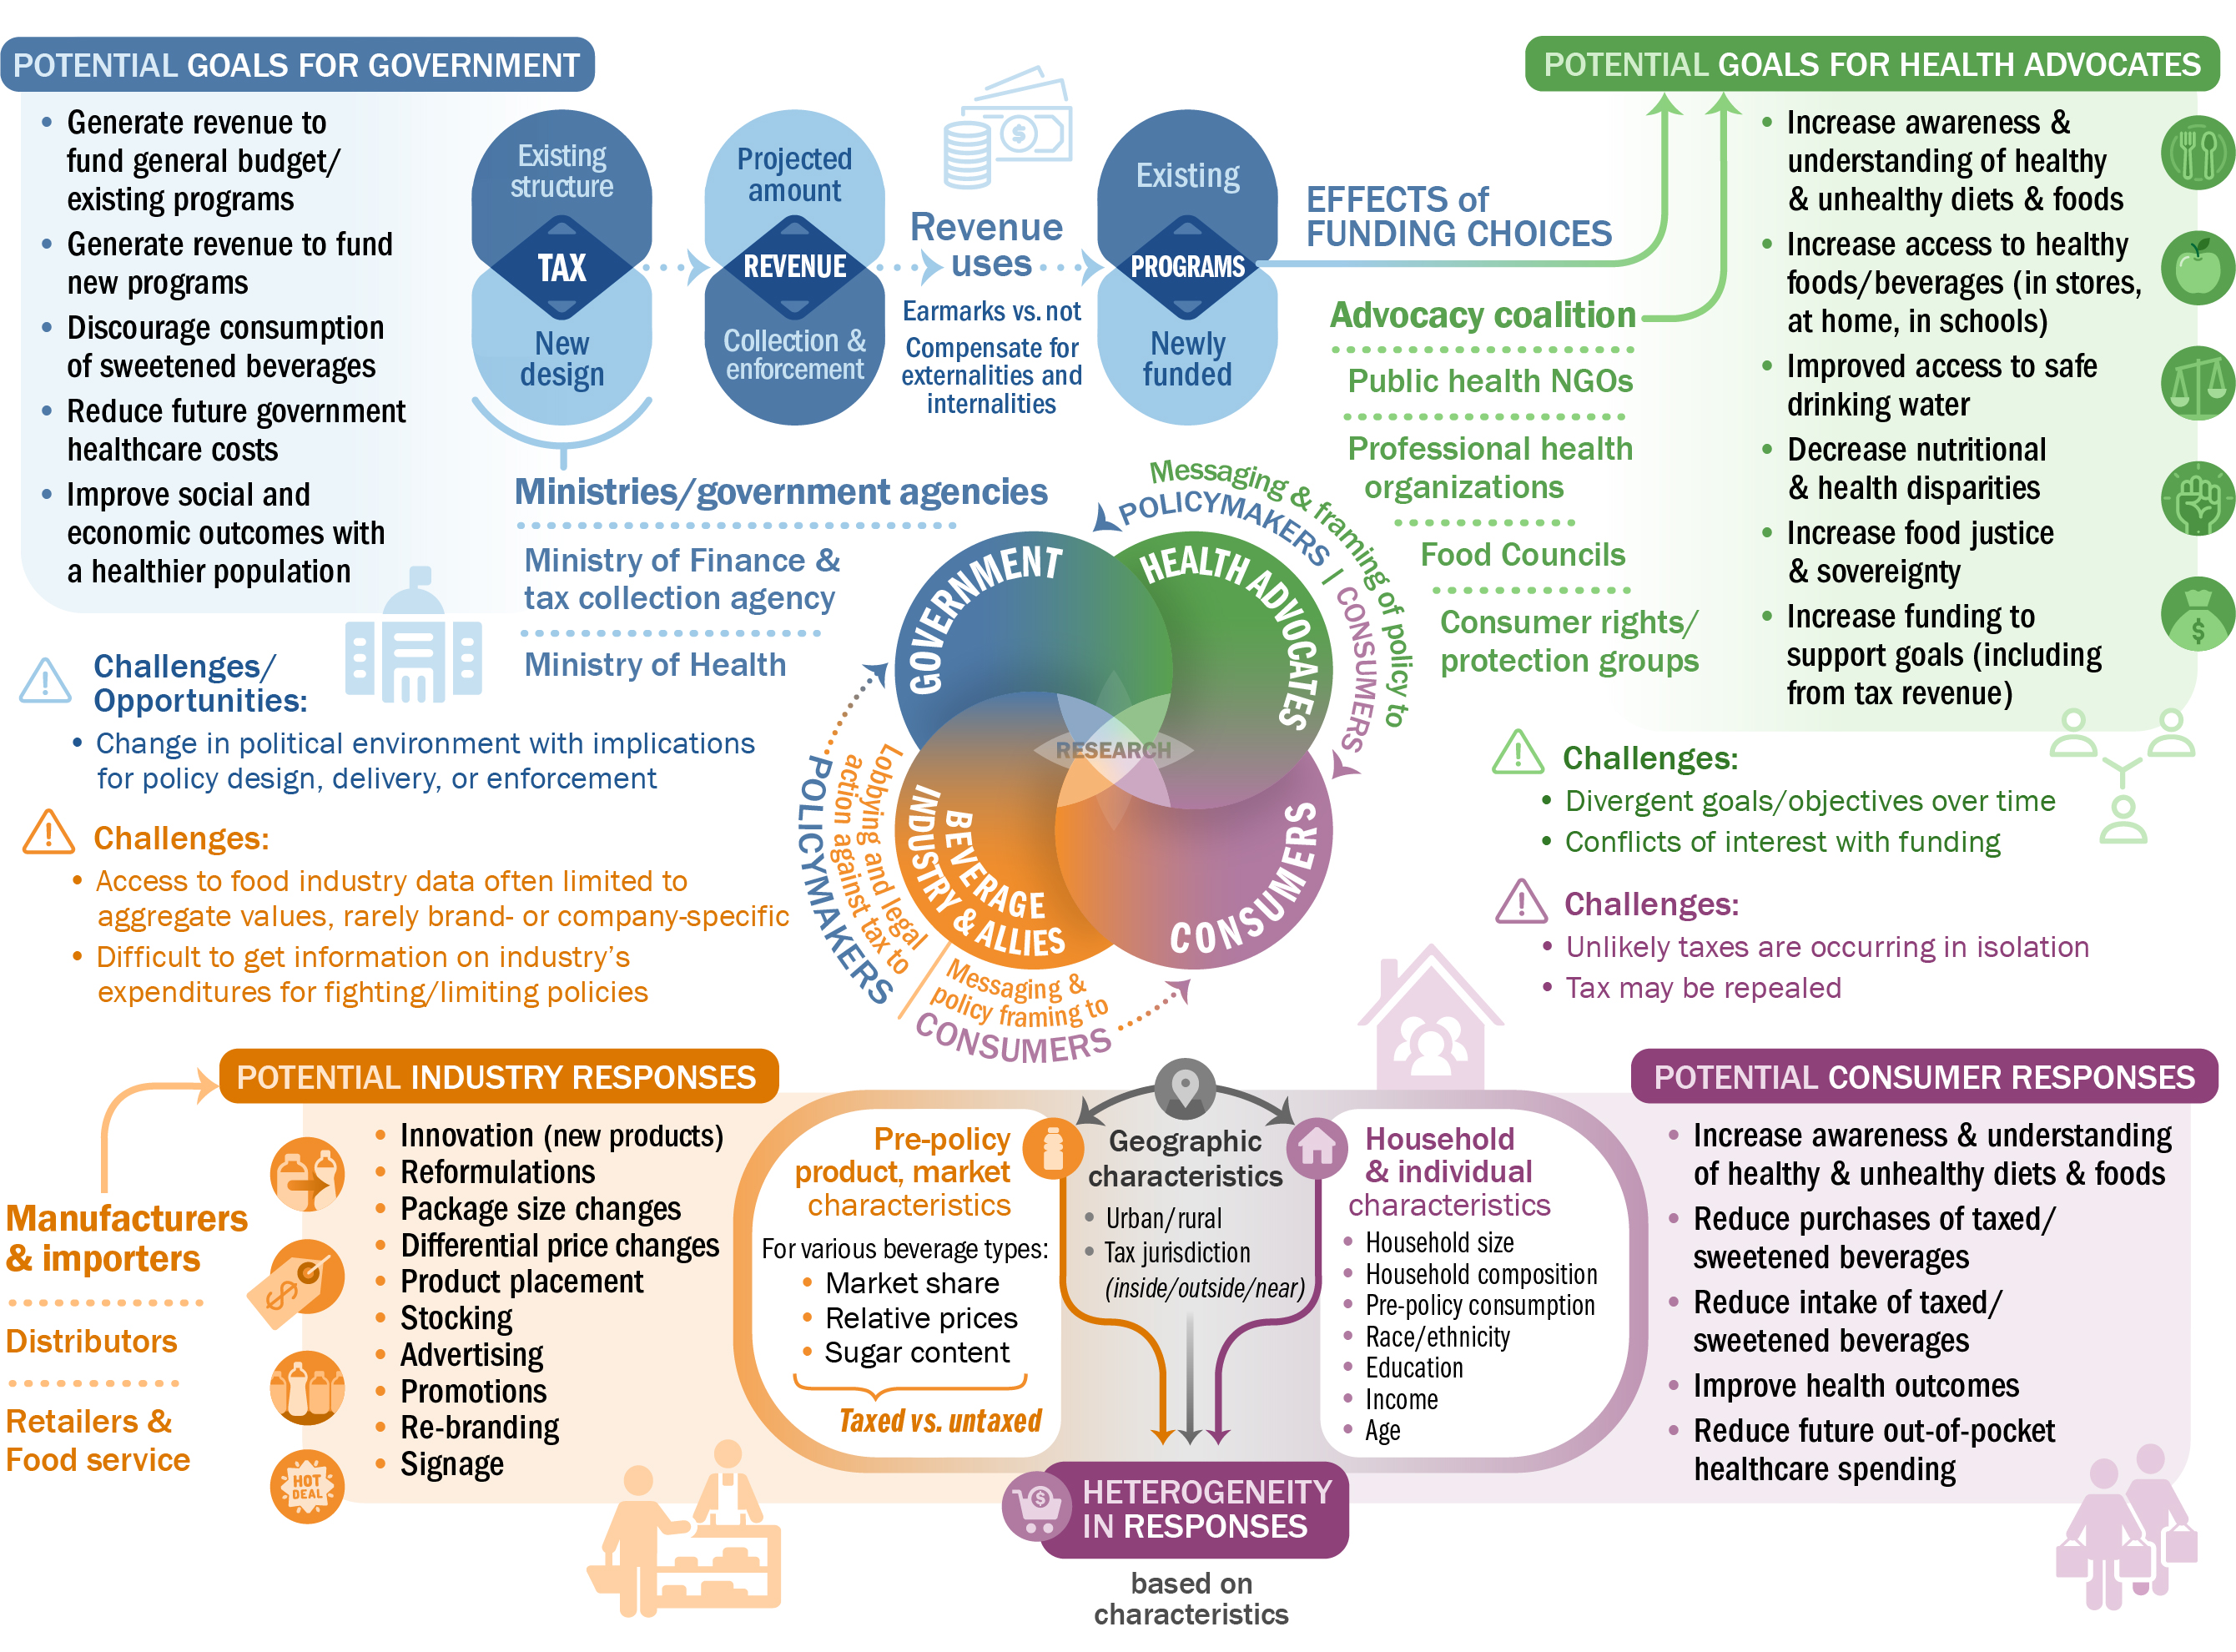
 Diagram showing the relationships between the interests of governments, health advocates, consumers, and industry, their potential responses to taxes, and measurable outcomes for evaluations.
 Diagram showing the relationships between the interests of governments, health advocates, consumers, and industry, their potential responses to taxes, and measurable outcomes for evaluations.